U.S. Senate
VOTE-SCOPE FORECAST · PROPRIETARY PROJECTION · EXCLUSIVE ADJUSTMENTS

RACE BOARD · RUN 2026-09-16
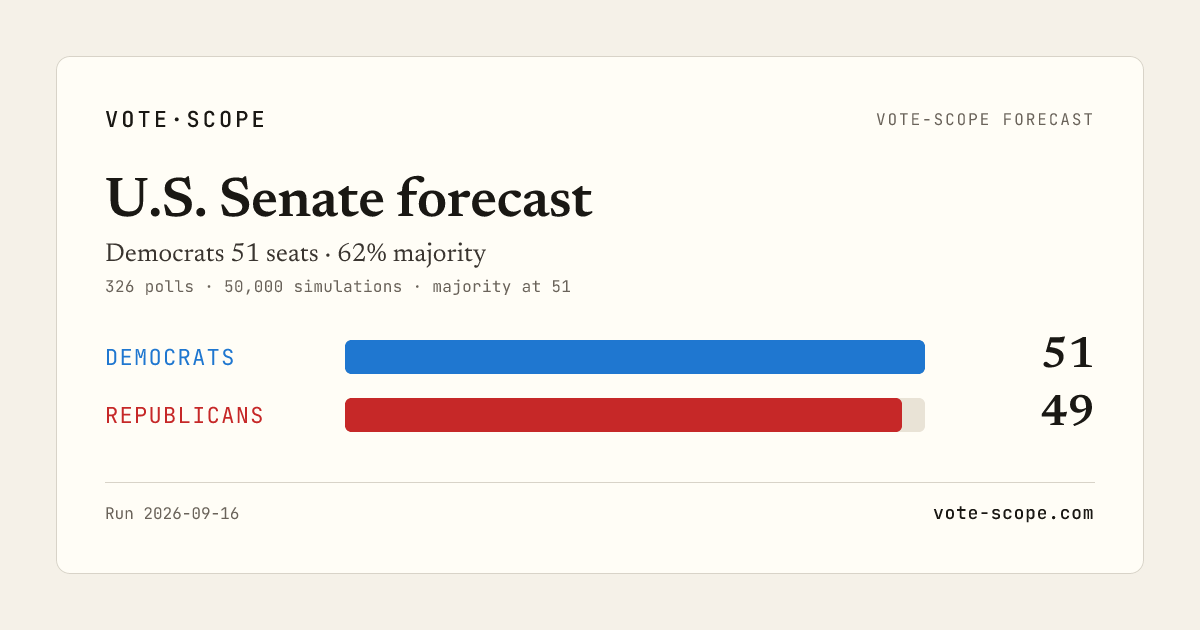
Democratic have the map. The market sees a much tighter chamber.
326 polls · 50,000 simulations · our exclusive read of the race
Watch list
The tightest races
Smallest projected margin. Open one for the numbers.
Current Senate Composition
Seats — 100 total
- Republican 53
- Democratic 47
Seat projection
 Democratic
 - Vote
- —
- P(majority)
- 62%
- P(largest)
- 72%
 Republican
 - Vote
- —
- P(majority)
- 10%
- P(largest)
- 15%
Analysis
Vote intention
Raw polls (dots) and model estimate (diamonds) with 95% confidence interval.
Scenario probabilities
Probability of winning a majority or finishing strictly first, across the 50,000 Monte Carlo simulations.
Riding map
Color = projected leading party. Hover a riding for details.
All ridings
Sort and filter the 100 ridings by projected winning party, margin and probability.
| Riding | Prov. | Projection | Vote% | Margin | P(win) | vs 2024 |
|---|---|---|---|---|---|---|
| Alaska | AK | Republican | 50.5% | 2.3% | 71% | Hold |
| Iowa | IA | Republican | 49.9% | 2.7% | 53% | Hold |
| Texas | TX | Democratic | 50.5% | 3.2% | 66% | Republican → Democratic |
| Maine | ME | Democratic | 50.8% | 3.5% | 68% | Republican → Democratic |
| Ohio | OH | Democratic | 50.9% | 4.4% | 76% | Republican → Democratic |
| Kansas | KS | Republican | 52.1% | 4.7% | 97% | Hold |
| Minnesota | MN | Democratic | 51.4% | 4.8% | 97% | Hold |
| Michigan | MI | Democratic | 51.7% | 5.0% | 78% | Hold |
| South Carolina | SC | Republican | 51.6% | 5.3% | 75% | Hold |
| Florida | FL | Republican | 52.5% | 5.7% | 92% | Hold |
| New Hampshire | NH | Democratic | 52.5% | 6.8% | 87% | Hold |
| North Carolina | NC | Democratic | 53.3% | 7.3% | 92% | Republican → Democratic |
| Georgia | GA | Democratic | 53.6% | 8.8% | 93% | Hold |
| Mississippi | MS | Republican | 53.4% | 8.8% | 82% | Hold |
| Nebraska | NE | Republican | 54.4% | 9.2% | 99% | Hold |
| Montana | MT | Republican | 42.9% | 10.2% | 85% | Hold |
| South Dakota | SD | Republican | 45.7% | 10.5% | 62% | Hold |
| Virginia | VA | Democratic | 56.2% | 12.9% | 98% | Hold |
| Kentucky | KY | Republican | 56.3% | 13.0% | 100% | Hold |
| New Mexico | NM | Democratic | 56.9% | 14.2% | 99% | Hold |
| Alabama | AL | Republican | 57.6% | 15.5% | 99% | Hold |
| Colorado | CO | Democratic | 57.1% | 16.5% | 99% | Hold |
| Idaho | ID | Republican | 49.3% | 17.6% | 92% | Hold |
| Louisiana | LA | Republican | 59.0% | 21.6% | 100% | Hold |
| Illinois | IL | Democratic | 58.5% | 23.2% | 100% | Hold |
| New Jersey | NJ | Democratic | 60.8% | 23.4% | 100% | Hold |
| Tennessee | TN | Republican | 59.4% | 23.7% | 100% | Hold |
| Massachusetts | MA | Democratic | 61.7% | 23.8% | 100% | Hold |
| Oklahoma | OK | Republican | 57.9% | 23.8% | 100% | Hold |
| Oregon | OR | Democratic | 60.5% | 24.7% | 100% | Hold |
| Arkansas | AR | Republican | 62.8% | 26.0% | 100% | Hold |
| Rhode Island | RI | Democratic | 61.5% | 26.7% | 100% | Hold |
| Delaware | DE | Democratic | 63.0% | 28.6% | 100% | Hold |
| West Virginia | WV | Republican | 68.1% | 38.9% | 100% | Hold |
| Wyoming | WY | Republican | 69.0% | 40.7% | 100% | Hold |
The race question
Is the Senate map competitive enough to overcome its structural tilt?
Senate control is decided in a handful of states, not a national vote. A modest national shift barely moves the map; recruitment, incumbency and late money in the closest races move it far more.
How we got here
How we got here
Senate control is never a national popular-vote contest: only the seats scheduled in this class are exposed. That makes geography and incumbency the first layer of the story.
Probabilities describe the range of plausible chamber outcomes; they do not erase distinct state coalitions.
What just changed
What just changed
LATEST REVIEW
The map before the wave
We read polls, recruitment and spending state by state before interpreting any national swing — only the seats in this class are exposed, so geography moves the chamber more than the topline. The live tables above show the current run.
Our read: Watch item — not automatically treated as a model input.
What can still change the race
What can still change the race
- Recruitment and primary outcomes in the closest states.
- Whether presidential approval moves consistently across several weeks.
- Spending decisions that reveal where both parties see real opportunity.