U.S. House
VOTE-SCOPE FORECAST · PROPRIETARY PROJECTION · EXCLUSIVE ADJUSTMENTS

RACE BOARD · RUN 2026-09-16
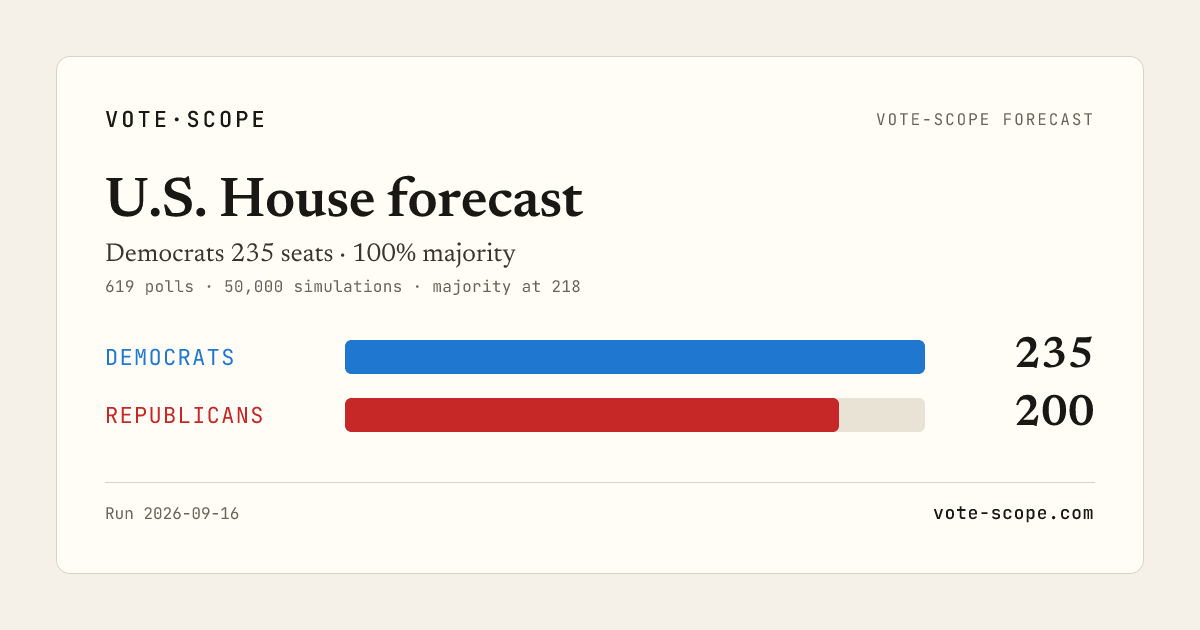
Democratic lead by 35 seats. The market is more bullish.
619 polls · 50,000 simulations · our exclusive read of the race
Watch list
The tightest races
Smallest projected margin. Open one for the numbers.
Current House Composition
Seats — 435 total
- Republican 218
- Democratic 214
- Vacant 3
Seat projection
 Democratic ▬ +0.3
 - Vote
- 54.4%
- P(majority)
- 100%
- P(largest)
- 100%
 Republican ▼ -0.4
 - Vote
- 44.7%
- P(majority)
- 0%
- P(largest)
- 0%
Analysis
Vote intention
Raw polls (dots) and model estimate (diamonds) with 95% confidence interval.
Scenario probabilities
Probability of winning a majority or finishing strictly first, across the 50,000 Monte Carlo simulations.
Riding map
Color = projected leading party. Hover a riding for details.
All ridings
Sort and filter the 435 ridings by projected winning party, margin and probability.
| Riding | Prov. | Projection | Vote% | Margin | P(win) | vs 2024 |
|---|---|---|---|---|---|---|
| FL-22 | FL | Democratic | 50.3% | 1.1% | 68% | Republican → Democratic |
| AZ-2 | AZ | Republican | 50.1% | 1.1% | 57% | Hold |
| OH-10 | OH | Democratic | 50.2% | 1.1% | 60% | Republican → Democratic |
| OH-15 | OH | Republican | 50.2% | 1.1% | 62% | Hold |
| NC-11 | NC | Democratic | 50.4% | 1.2% | 74% | Republican → Democratic |
| OH-7 | OH | Democratic | 50.4% | 1.2% | 77% | Republican → Democratic |
| WI-1 | WI | Republican | 50.0% | 1.3% | 62% | Hold |
| FL-13 | FL | Republican | 50.0% | 1.3% | 80% | Hold |
| TX-35 | TX | Republican | 50.3% | 1.3% | 67% | Hold |
| OH-9 | OH | Democratic | 50.1% | 1.5% | 55% | Hold |
| FL-16 | FL | Republican | 50.6% | 1.6% | 78% | Hold |
| TX-34 | TX | Democratic | 50.7% | 1.6% | 88% | Hold |
| FL-7 | FL | Republican | 50.5% | 1.7% | 70% | Hold |
| FL-4 | FL | Republican | 50.4% | 1.7% | 64% | Hold |
| MO-2 | MO | Republican | 50.1% | 1.7% | 75% | Hold |
| MI-4 | MI | Republican | 50.6% | 1.9% | 78% | Hold |
| MT-1 | MT | Democratic | 50.5% | 1.9% | 93% | Republican → Democratic |
| CA-40 | CA | Republican | 50.7% | 2.0% | 77% | Hold |
| AL-2 | AL | Republican | 51.0% | 2.1% | 96% | Democratic → Republican |
| TX-15 | TX | Republican | 51.1% | 2.2% | 96% | Hold |
| CO-4 | CO | Republican | 49.6% | 2.2% | 81% | Hold |
| NC-1 | NC | Democratic | 51.1% | 2.3% | 97% | Hold |
| IA-2 | IA | Republican | 51.1% | 2.5% | 93% | Hold |
| FL-27 | FL | Republican | 51.3% | 2.6% | 96% | Hold |
| PA-1 | PA | Republican | 51.3% | 2.6% | 98% | Hold |
| FL-14 | FL | Democratic | 51.3% | 2.6% | 94% | Republican → Democratic |
| TX-23 | TX | Republican | 51.2% | 2.6% | 88% | Hold |
| TX-28 | TX | Democratic | 51.3% | 2.7% | 98% | Hold |
| VA-1 | VA | Republican | 51.3% | 2.7% | 90% | Hold |
| AZ-8 | AZ | Republican | 51.4% | 2.9% | 92% | Hold |
| NC-3 | NC | Republican | 51.4% | 2.9% | 96% | Hold |
| CO-5 | CO | Republican | 50.5% | 3.2% | 97% | Hold |
| AR-2 | AR | Republican | 51.6% | 3.3% | 99% | Hold |
| CO-3 | CO | Democratic | 51.0% | 3.4% | 98% | Republican → Democratic |
| FL-11 | FL | Republican | 51.8% | 3.5% | 98% | Hold |
| MI-7 | MI | Democratic | 51.4% | 3.7% | 100% | Republican → Democratic |
| NY-2 | NY | Republican | 45.5% | 3.7% | 97% | Hold |
| NC-7 | NC | Republican | 52.0% | 4.0% | 100% | Hold |
| OH-8 | OH | Republican | 52.0% | 4.0% | 98% | Hold |
| NC-14 | NC | Republican | 52.0% | 4.1% | 98% | Hold |
| FL-25 | FL | Democratic | 52.0% | 4.1% | 99% | Hold |
| SC-1 | SC | Republican | 52.1% | 4.1% | 100% | Hold |
| MI-10 | MI | Democratic | 51.4% | 4.4% | 100% | Republican → Democratic |
| WI-8 | WI | Republican | 52.2% | 4.4% | 98% | Hold |
| VA-5 | VA | Republican | 52.2% | 4.4% | 100% | Hold |
| VA-2 | VA | Democratic | 52.0% | 4.5% | 100% | Republican → Democratic |
| FL-12 | FL | Republican | 52.3% | 4.5% | 99% | Hold |
| TX-24 | TX | Republican | 52.3% | 4.5% | 99% | Hold |
| NC-9 | NC | Republican | 52.3% | 4.6% | 99% | Hold |
| NJ-7 | NJ | Democratic | 52.3% | 4.7% | 100% | Republican → Democratic |
The race question
Can either party build a durable House majority in a nationalized midterm?
The national mood sets the field, but control is won district by district: retirements, recruitment and a small set of suburban seats can outweigh a modest polling lead.
How we got here
How we got here
The House has spent several cycles on a narrow knife-edge. Redistricting reduced the number of truly elastic districts, making candidate quality and local turnout unusually consequential.
Read the projection as today’s map of uncertainty—not a forecast frozen until election day. The seat distribution matters more than any single headline average.
What just changed
What just changed
LATEST REVIEW
The model and the market rarely agree
Where the district-by-district model and prediction markets diverge is the real story: markets often price a wave the seat math still reads as a knife-edge. The live tables above always show the current run.
Our read: Watch item — not automatically treated as a model input.
What can still change the race
What can still change the race
- Candidate fields and retirements in competitive districts.
- A sustained movement in the generic ballot rather than a one-day reaction.
- Turnout and persuasion gaps across suburban, Latino and working-class districts.